
Unit Summary
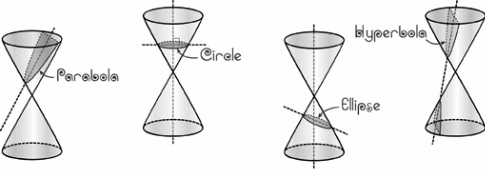
In this unit, Algebra 2 students grades 9-12 will study Conic Sections. Conics are the shapes you get when you slice a cone, or more precisely, the curve obtained by the intersection of a cone and a plane. Conic sections include parabolas, hyperbolas, ellipses, and circles. We will take time studying the shapes of the conics' corresponding graphs as well as their corresponding equations. We will also study how to graph a conic when given its equation. Don't worry if this unit seems dull, we will use some interesting resources to help you understand and appreciate how conics are used in the real world!
|
- Identifying basic shapes of the 4 conics (namely, parabolas, hyperbolas, ellipses, and circles)
- Identifying conics from their equations in standard form - Graphing a conic given its equation - Matching graphs with their equations |
Student Learning Objectives
Students will be able to successfully answer questions about conics that I may ask them in class. Students will be able to complete homework and classwork in a timely fashion and with correct answers. Given banks of equations and graphs, students will be able to match them up correctly and explain why. Students will be able to graph conics and their translations from given equations. Given just a graph, students will be able to write out its corresponding equation. Students will be able to determine characteristics of conics from their equations and graphs.
California Content Standards
Represent and solve equations graphically.
10. Understand that the graph of an equation in two variables is the set of all its solutions plotted in the coordinate plane, often forming a curve (which could be a line).
11. Explain why the x-coordinates of the points where the graphs of the equations y = f(x) and y = g(x) intersect are the solutions of the equation f(x) = g(x); find the solutions approximately, e.g., using technology to graph the functions, make tables of values, or find successive approximations. Include cases where f(x) and/or g(x) are linear, polynomial, rational, absolute value, exponential, and logarithmic functions.
Create equations that describe numbers or relationships. [Equations using all available types of expressions, including simple root functions.]
1. Create equations and inequalities in one variable including ones with absolute value and use them to solve problems. Include equations arising from linear and quadratic functions, and simple rational and exponential functions. CA «
2. Create equations in two or more variables to represent relationships between quantities; graph equations on coordinate axes with labels and scales. «
3. Represent constraints by equations or inequalities, and by systems of equations and/or inequalities, and interpret solutions as viable or non-viable options in a modeling context.
4. Rearrange formulas to highlight a quantity of interest, using the same reasoning as in solving equations.«
Build new functions from existing functions. [Include simple radical, rational, and exponential functions; emphasize common effect of each transformation across function types.]
3. Identify the effect on the graph of replacing f(x) by f(x) + k, kf(x), f(kx), and f(x + k) for specific values of k (both positive and negative); find the value of k given the graphs. Experiment with cases and illustrate an explanation of the effects on the graph using technology. Include recognizing even and odd functions from their graphs and algebraic expressions for them.
